Executive Summary: A Dynamic Start to the Year
The Peruvian export landscape demonstrated remarkable vitality in the first two months of 2026. According to the latest data released by the Association of Exporters (ADEX), the country saw 4,902 distinct business entities participate in international trade, representing a 4.2% increase compared to the same period in 2025. These enterprises collectively navigated a complex global environment to deliver 2,621 different products to 119 international markets.
While the sheer volume of participating companies highlights a robust entrepreneurial spirit, the underlying data reveals a nuanced story of concentration, resilience, and the ongoing challenges faced by micro, small, and medium-sized enterprises (MSMEs) in sustaining their footprint on the global stage.
Chronology of Trade Dynamics: A Two-Month Snapshot
The first 60 days of 2026 serve as a critical barometer for the Peruvian economy. The data, compiled in collaboration with the Superintendency of Tax Administration (SUNAT), paints a picture of a sector in transition.
- January 2026: The year commenced with a surge in interest from emerging exporters, many of whom sought to capitalize on renewed demand in the agro-industrial sector.
- February 2026: While market volatility remained a concern, the total number of exporting firms held steady, cementing the 4.2% growth rate.
- The "Long-Haul" Cohort: A significant takeaway from the ADEX report is the endurance of the "legacy" firms. Out of the total pool, 181 companies have maintained uninterrupted export operations since the year 2000. This group acts as the backbone of the country’s trade identity, consisting of 73 large enterprises, 62 small firms, 34 micro-enterprises, and 12 medium-sized ones. Their ability to survive two and a half decades of economic shifts provides a masterclass in operational sustainability.
Supporting Data: The Anatomy of Peruvian Exports
The structure of Peruvian exports is defined by a sharp divide between the quantity of participants and the total financial value generated.
The Composition of the Exporting Base
The statistical distribution of the 4,902 companies reflects a heavy reliance on the micro-enterprise sector for sheer volume:
- Micro-enterprises: 3,098 firms (63.2% of the total).
- Small enterprises: 1,582 firms (32.3%).
- Large enterprises: 170 firms (3.5%).
- Medium enterprises: 52 firms (1.1%).
The Economic Reality: FOB Value Disparity
When analyzing the Free on Board (FOB) value—which reached an impressive total—the concentration of power shifts dramatically toward large corporations. Of the total export value of approximately US$ 8.6 billion (calculated from reported percentages), the breakdown is as follows:
- Large Enterprises: 85% share (US$ 7,308 million).
- Small Enterprises: 11.7% share (US$ 1,008 million).
- Medium Enterprises: 2.4% share (US$ 204 million).
- Micro-enterprises: 1% share (US$ 82 million).
This data underscores the "productivity gap" that continues to challenge the Peruvian economy. While micro-enterprises represent the majority of the actors, their contribution to total export revenue remains disproportionately low, highlighting the need for increased technological adoption and scaling strategies.
The Churn Rate: Market Entry and Exit
A vital aspect of the ADEX report is the analysis of market "churn." During this period, 1,677 companies ceased their international operations. The report notes that 98.2% of these departures were MSMEs, while large corporations accounted for only 1.8%. This suggests that smaller firms are significantly more vulnerable to fluctuations in logistics costs, currency devaluation, and international regulatory hurdles.
Conversely, the ecosystem remains vibrant, with 1,875 new entrants joining the export scene. The breakdown of these newcomers includes 1,227 micro-enterprises, 574 small firms, 42 large corporations, and 32 medium-sized businesses. This constant turnover indicates a highly competitive market where the "survival of the fittest" dictates growth.
Sectoral Distribution: Beyond Commodities
The diversification of the Peruvian export basket remains a priority for trade authorities. The current rankings show that while traditional sectors remain strong, the complexity of products is increasing.
The Leading Sectors
- Agro-industry: 1,391 companies. This sector continues to be the primary engine for employment and regional development.
- Mining: 1,073 companies. A foundational pillar of the economy, showing consistent, high-value output.
- Chemicals: 697 companies.
- Metalworking: 678 companies.
- Miscellaneous: 510 companies.
Emerging and Specialized Niches
Other notable contributors include:
- Apparel/Garments: 491 firms.
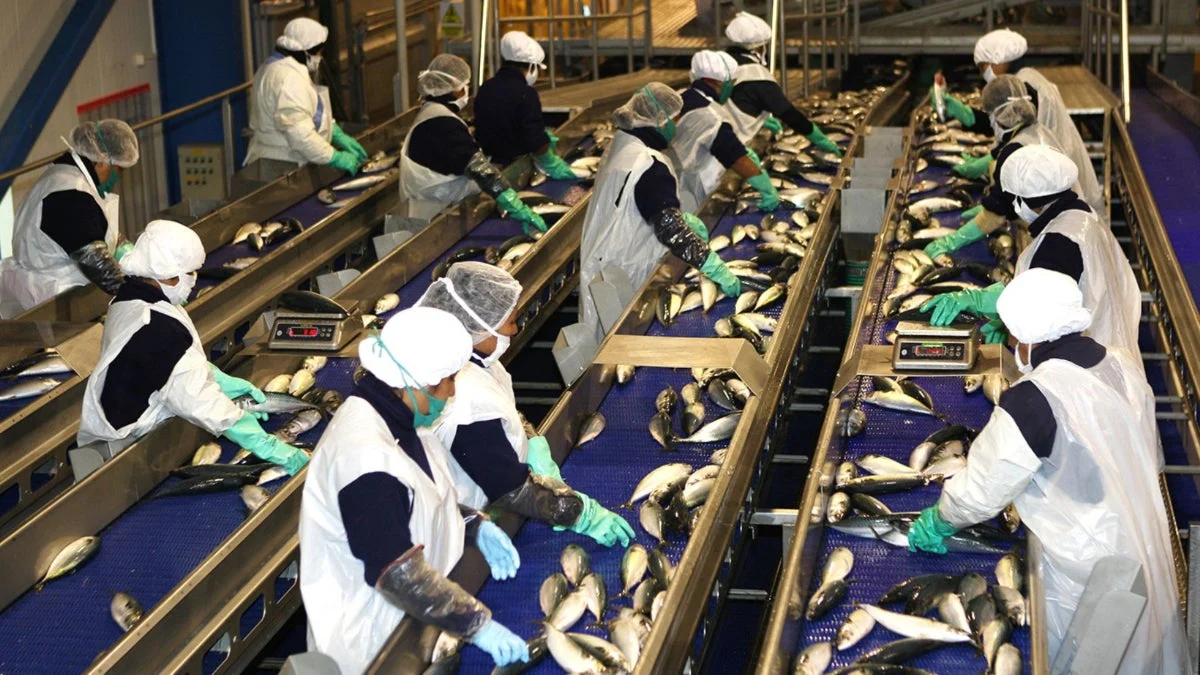
- Fisheries and Aquaculture: 232 firms.
- Textiles: 206 firms.
- Siderometallurgy: 204 firms.
- Traditional Agriculture/Mining: 198 and 182 firms, respectively.
- Specialized niches: Including wood products (67), jewelry (41), hydrocarbons (31), and traditional fisheries (28).
Official Perspective and Strategic Implications
ADEX, through its spokespeople, has emphasized that while the growth in the number of exporters is a positive signal, the country must focus on "export depth." This refers to increasing the value-add of the products exported rather than relying solely on raw commodity shipments.
Implications for Public Policy
The data carries several implications for the Peruvian government and the private sector:
- Closing the Productivity Gap: The concentration of 85% of export value in 170 large firms suggests that the "exporting miracle" has yet to fully permeate the SME sector. Targeted tax incentives and technical assistance programs are essential to help small firms move up the value chain.
- Mitigating Exit Factors: The departure of 1,677 firms highlights a need for better trade facilitation. Many of these firms likely succumbed to administrative burdens rather than a lack of product quality. Streamlining customs procedures and providing trade financing could help stabilize this turnover.
- Market Diversification: While reaching 119 markets is a significant achievement, the concentration of these exports into specific regional trade blocs remains a risk. Expanding into underutilized markets in Asia and Africa could mitigate the impact of economic slowdowns in North America or Europe.
- The Role of Innovation: The high number of newcomers (1,875) proves that there is no shortage of entrepreneurial talent in Peru. The challenge is ensuring these new entrants have the digital and logistical infrastructure to remain viable beyond their first year of operation.
Conclusion: The Path Forward
The first two months of 2026 have set a clear trajectory for Peru’s export sector. With a 4.2% increase in participating firms, the nation is demonstrating resilience in the face of global uncertainty. However, the true test for the remainder of the year will be whether the country can move beyond mere volume and toward a more equitable distribution of export revenue. By strengthening the capabilities of MSMEs and fostering a more stable environment for emerging exporters, Peru can solidify its position as a key player in the global supply chain, transforming its current trade potential into sustainable, long-term national wealth.
As ADEX continues to monitor these metrics, the focus remains on transforming the Peruvian export model into one that is not only vast in reach but also deep in industrial sophistication and economic inclusivity.